The Retirement Hierarchy of Needs, Part 1
I know this is cliche, but I’ve got to say it: This is a long post but it is well worth a read. This blog marks the start of a four part series on what we at Tarkenton Financial call the Retirement Hierarchy of Needs. The Retirement Hierarchy of Needs is a philosophy on how to build a comprehensive financial plan for a client. The idea is to make sure to cover all of the needs, wants, and risks that my arise in a client’s retirement, with the most efficient financial tools available. Let’s look at the hierarchy.

With each tier of the hierarchy comes different types of expenses or goals for the money. You work with the client to determine how much money you need to allocate to each tier. In each post of the series, we will look at a different tier. We will discuss what expenses or risks are included in that tier and look at different ways to solve for those expenses.

We will start at the base of the hierarchy. The Need to Haves. These are the mandatory expenses clients will have in retirement. Expenses like, housing, food, utilities, medical expenses, etc. It should be clear that these expenses or needs are defined by the client. For example, if a client says they “need” to play golf in retirement, they, in fact, do need to play golf in retirement. Now you can push back with questions like, “If you had to sacrifice golf for food, would that be OK?” Although, this should only be the case if they don’t have the money to guarantee both. Ask the client to fill out a budget sheet and identify which of those expenses must be paid for each year. Their non-negotiables, if you will. Once you have that number, you can back into the amount needed for each product/strategy that would be used to solve for the Need to Haves.
Let’s look at a case study, assuming the client needs $20,000/year to cover the gap between guaranteed income sources they already have set up (i.e. Social Security, pensions, etc.) and what their Need to Have expenses are. The client is 55 and would like to retire at 66. We will examine four different strategies for guaranteed income:
- using an equities portfolio
- a bond ladder
- a variable annuity
- a fixed indexed annuity
We will compare four different areas for each strategy:
- investment needed to achieve income goal
- investment value after 10 years
- total income received after 10 years
- cumulative fees paid over ten years
In each scenario, we are assuming zero growth to make sure we are comparing apples to apples. The income and account balance on the bond ladder grows because I used actual current coupon rates, so as the bonds mature the average coupon rate increases. Let’s look at the chart below.
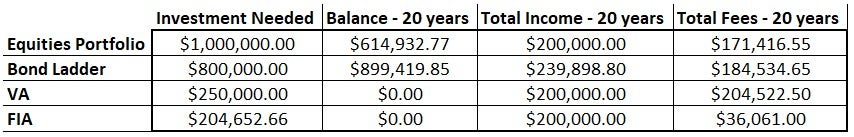
First things first, can we all agree that if there were zero growth in any of these strategies over the next 20 years, we would have much bigger things to worry about than what the most efficient strategy is. OK, now that we agree on that, remember that I am illustrating a zero-growth environment because we need to take out hypothetical, sometimes misleading, growth numbers; so that we are comparing “worst-case scenario” scenarios. I would like to address each strategy as it compares to the FIA strategy.
Equities Portfolio
We will start with the Equities Portfolio compared to the FIA. It was tough for me to decide how to illustrate this strategy on a level playing field with the other three. I came up with an imperfect method to compare an imperfect strategy. So, aside from just looking at the chart above, let’s dive a little deeper into the numbers of the Equities Portfolio strategy. To achieve $20,000 a year in income, you must have a starting point of $1,000,000. I chose to illustrate this with having that number at age 55 and seeing no growth. Another way of looking at it would be to chose an average rate of return you think is attainable. Let’s say we think we can get 5% a year. That means, at age 55, the client would have to have $644,608.92 and then earn 5% every year until 66 when they start withdrawing the $20,000 a year. Compared to the FIA where they put in $204,652.66, at age 55, and have to earn 0% a year. And yes, in the Equities Portfolio, you have a higher likelihood of having some of your principal left at the end of life, but you do not have a guarantee that your money will not run out. When you factor in sequence of returns, your likelihood of having any principal left at the end of your life is greatly reduced. Let’s look at how a $1,000,000 equities portfolio, where you are pulling 2% a year adjusted for inflation, would perform compared to an equities portfolio with $204,652 carved out for an FIA to create the $20,000 a year.
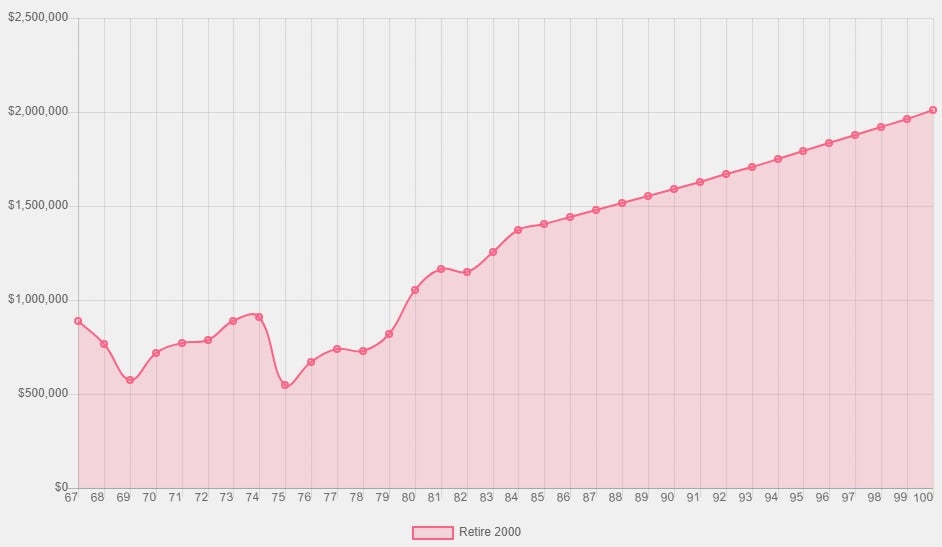
In the chart above, you see a hypothetical scenario of taking $20,000 a year, adjusted 3% each year for inflation, off of a $1,000,000 equities portfolio. At age 100, it is worth over $2,000,000. This scenario is based on historical S&P 500 returns, assuming the client retires in the year 2000 at age 66 and in 2018 the annual return goes to 5%. Not bad, this is with one of the worst-case scenarios we have seen in the S&P 500 for sequence of returns risk. Let’s now look at a scenario where we have carved out $204,652 for an FIA.
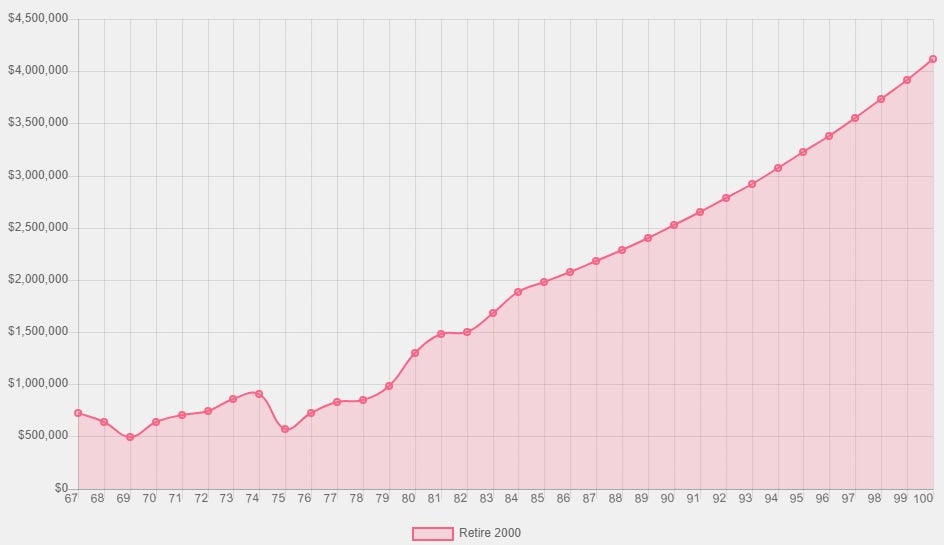
Above is the same market scenario, the only difference is that we carved out $204,652 for an FIA that will give us the $20,000 a year for life. By doing this, we allow the remaining $795,348 to grow without taking any money out of it; allowing that $795,348 to grow to over $4,000,000 by age 100. Twice as much compared to investing 100% into the equities portfolio and taking income from that. So, to summarize, by carving out a portion of the equities portfolio, before retirement, and moving that to an FIA to cover the guaranteed expenses, we have a much better chance of accumulating a greater amount of wealth for the client throughout their retirement.
Bond Ladder
Let’s move to the Bond Ladder. The numbers here mostly speak for themselves. While your likelihood of maintaining your principal is high, it does take more of an initial investment than the FIA, and your guarantee is only for 25 years (in this example). This strategy is reliant on where rates go while the current bond ladder is in place. Obviously, if rates go up, you’ll get a higher coupon rate with less principal, but the opposite is also true. Rates go down you are paying more for less income. While it seems hard to believe rates can go much lower than where they are now, think about where rates were 25 years ago and what they have done in between then and now. That is interest rate risk at it’s finest. So, while bond ladders have their place, I think when we are talking guaranteed lifetime income and most efficiently using your client’s dollars, we have to, again, consider the FIA.
Variable Annuity
The variable annuity narrows the gap in principal needed to achieve the $20,000 annual income goal. The numbers I used for the VA were based off of the guarantees from a specific industry-leading carrier. Again, to compare apples to apples, we are using a 0% return over 20 years. The FIA used is from another industry-leading carrier from a guaranteed level income basis. There are two key differences between the VA and the FIA. The first is the fact that the FIA has a 6% compounding interest roll-up on the income value vs. the VA that has 6% simple interest roll-up on the income value. This allows for the FIA to require a lower principal amount to be invested to achieve the $20,000 annual income goal. The second glaring difference between the two contracts is the fees. The comparisons of fee structures have a few factors to them. The glaring difference is the total fees in the two products. The FIA has a rider fee but no fee on the base contract and, since it is just tracking indexes, there aren’t any fees on the “investments” or “allocations” inside the contract. Just a rider fee. On the FIA I used in the above example, that fee is 1.05%. With the VA, it is a different story. If we compare just the rider fees, it is reasonable. The VA in the above example has a 1.55% rider fee for the guaranteed income portion of the contract. If only it stopped there. There is also a Mortality and Expense (M/E) fee that is 1.3% annually. Then there is the fee so many people forget about: the subaccount fee. In this case, it is relatively low at 0.92%. Some VA’s can have subaccount fees as high as 2.25%! If we total the FIA fees and compare them to the VA, we are looking at 1.05% vs. 3.77%. The other thing we need to consider when looking at fees is how they are calculated. In the example above, the VA fees are calculated off of the benefit base (income account value) not the actual account value, but then deducted from the account value. The FIA in the example above, calculates the fees from the actual account value; which will be a much lesser amount because you don’t have the guaranteed growth on that portion of the contract.
Conclusion
The moral of the story here is that, of course, there is not one right answer. There is however, only one option that is the most efficient and that has the contractual obligation and ability to fully guarantee that your clients won’t outlive their income, and that is the fixed indexed annuity, for the reasons outlined in this blog. If you have questions, comments, or would like to know more about the different products we offer, call us at 800-659-4942.